PAPrathamesh Adarkar
INDEPENDENT CASE STUDY / COMPANY NAME WITHHELD / 2026

The take ratedoesn’t cover it.

A US consumer-electronics launch, modelled end to end. The marketplace model everyone assumes is cheaper loses money on every order.

I built a market-entry proposal for an early e-commerce operator: what to stock, who they are really competing with, what a single order actually earns, and whether to sell first-party or take a commission from third-party sellers. Seven retailers benchmarked, a full unit-economic model, and a recommendation that contradicted the brief.

Follow the money on one order

Or read the proposal itself.

ROLE

Market research, unit-economic model, proposal and store prototype

BUILT WITH

Competitive analysis · Contribution modelling · HTML prototype

SCOPE

7 retailers benchmarked · 1P and 3P modelled · returns policy costed

01 / THE BRIEFSelf-directed · company anonymised
$90Modelled basket
$7.681P contribution per order
391Orders to cover fixed cost
7Retailers benchmarked
01

Nobody had put
a number on an order.

An early marketplace operator wanted to enter US consumer electronics. The plan was sensible in outline — start from an existing catalogue, add portable essentials, build toward higher-value items — and entirely unpriced. No one had worked out what a single dispatched order earns after the card fee, the box, the returns and the cost of finding the customer.

So that is what I built: a basket, a landed cost, and every deduction between them and the bank. The strategy argument follows from the arithmetic rather than the other way round.

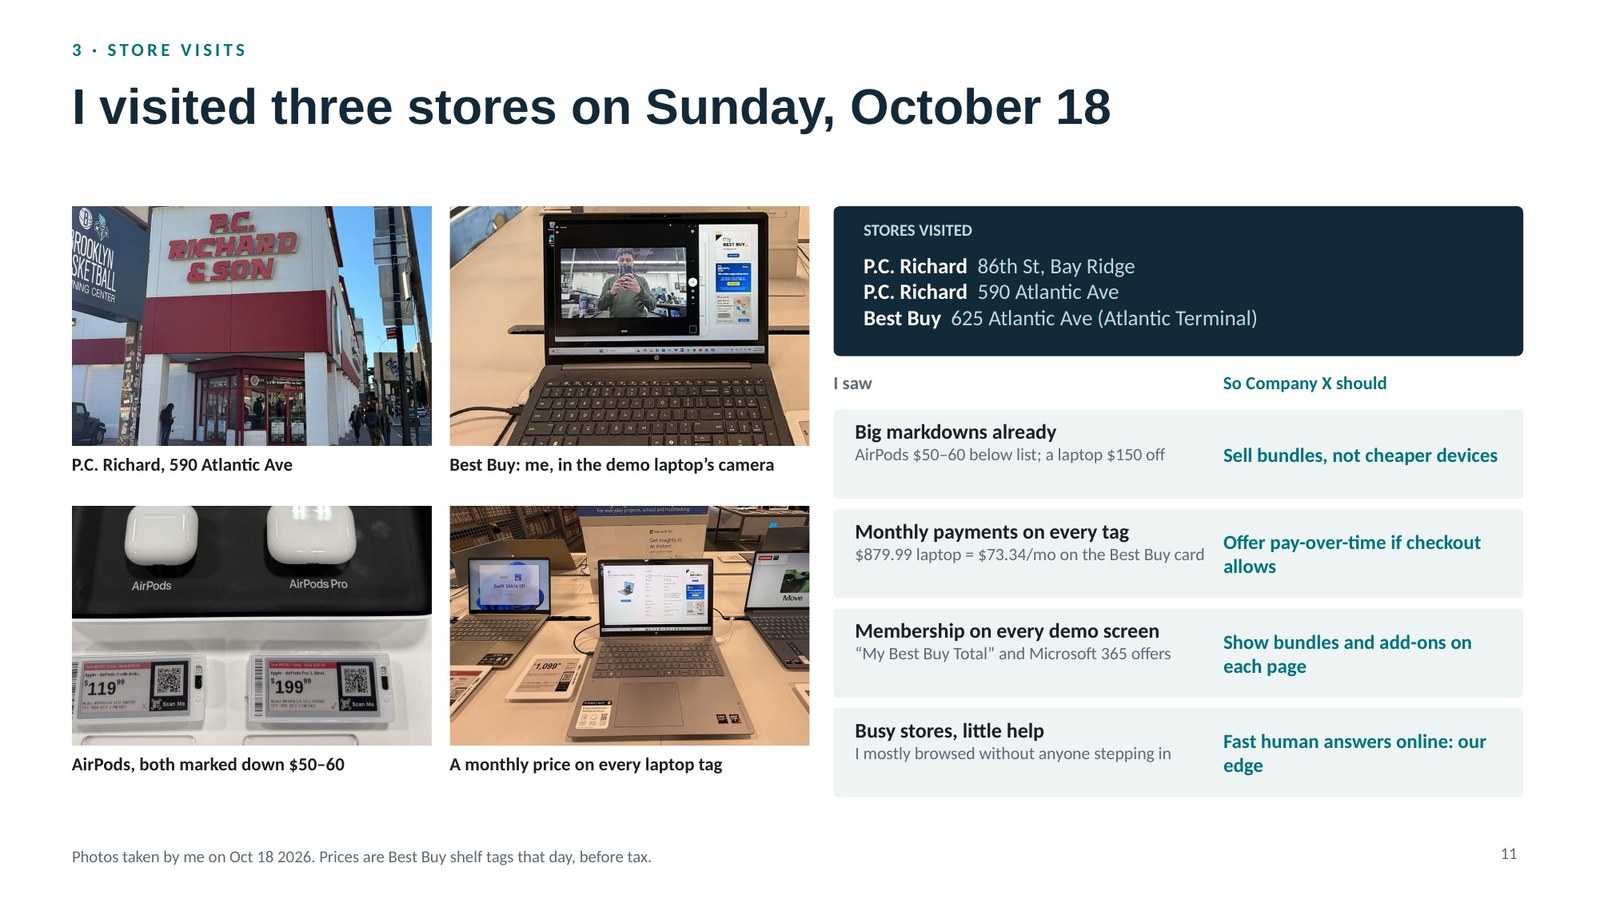
I also went and looked. Three stores in one Sunday — two Best Buy branches and a P.C. Richard & Son — to see what the incumbents actually put in front of a buyer: where the staff stand, how the warranty is pitched, what the shelf edge says about returns.
FIELD VISITS · SUNDAY 18 OCTOBERBest Buy ×2 · P.C. Richard & Son
Deck slide titled I visited three stores on Sunday, October 18, with photographs of Best Buy and P.C. Richard store interiors and notes on staffing, membership and layout.
The service layer is the part a spreadsheet cannot price. Seeing it in three stores is what made the competitive section an argument about trust rather than a price table.
All figures are assumptions, not supplier quotes

A $90 order earns
$7.68, and only if
you find the buyer cheaply.

Thirty per cent of a $90 basket is $27 of gross profit. By the time the card network, the carrier, the returns provision and the advertising have taken their share, $7.68 is left — and $8 of that journey was the advertising alone.

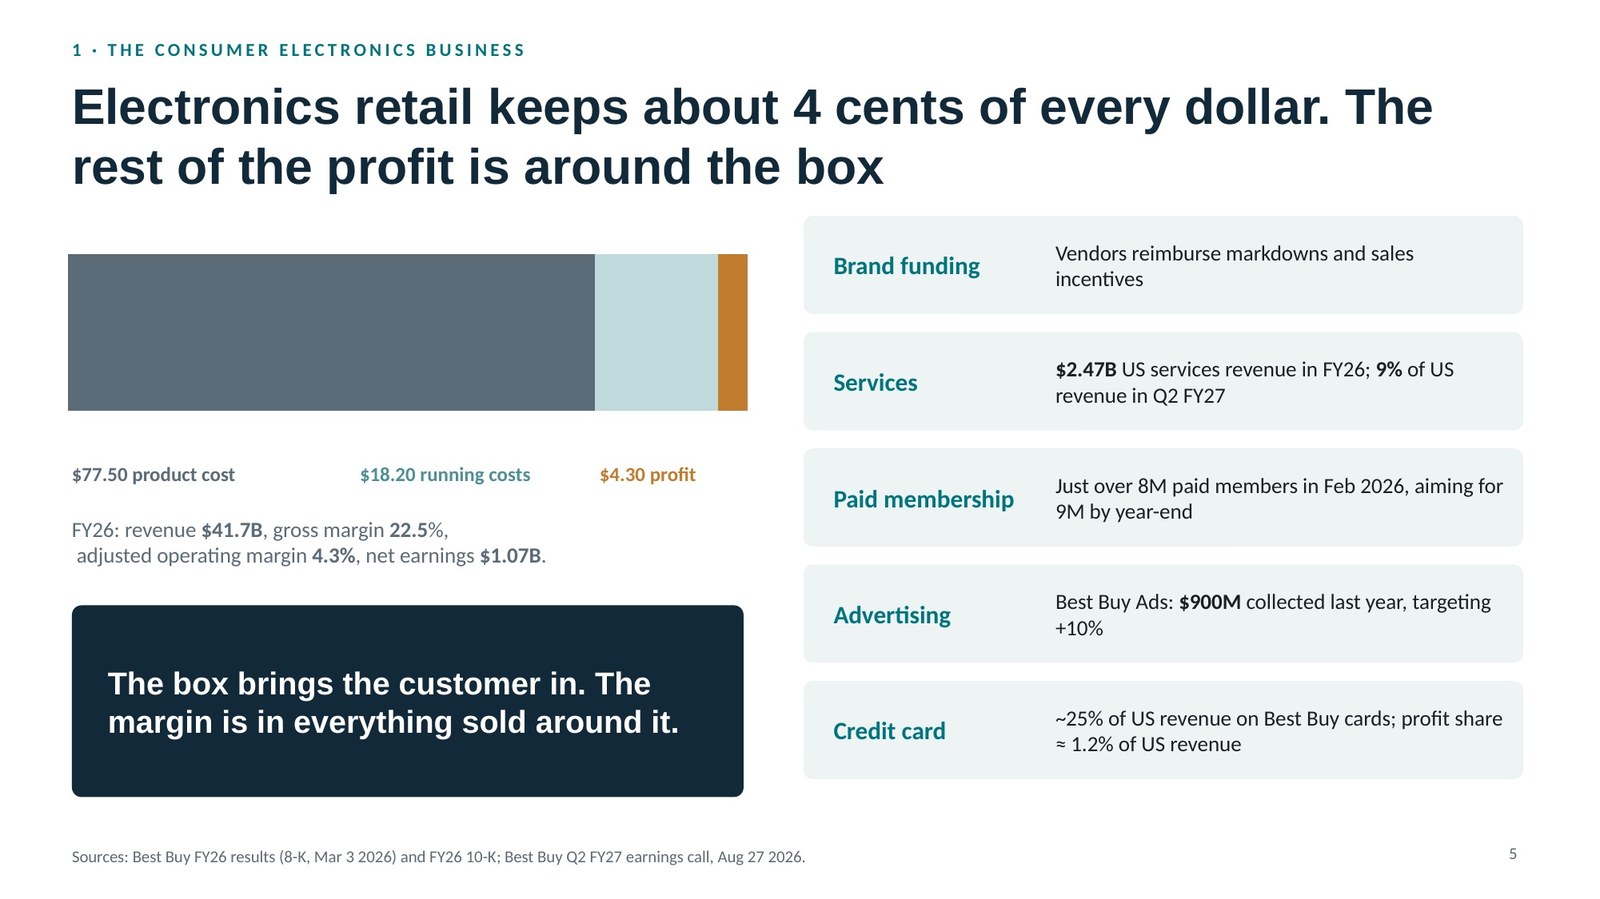
THE MARKET, FRAMED$371B category · ~4c retained per dollar
Deck slide reading Electronics retail keeps about 4 cents of every dollar; the rest of the profit is around the box, listing brand funding, services, paid membership, advertising and credit card as the margin sources.
Electronics retail keeps roughly four cents of every dollar on the box itself. Everything else — services, memberships, brand funding, card economics — is earned around it. That is the backdrop the contribution model sits in.
1P contribution bridgeA $90 order retains $25.57 of spread, which payment, outbound, returns, disputes and acquisition reduce to $7.68.WHERE A $90 ORDER ENDS UP · 1P$0$9$18$2725.57Retainedspread−2.91Payment−6.00Outbound−0.75Returns−0.23Disputes−8.00Acquisition7.67Contribution$90 sale, $63 landed. Every figure is an analyst assumption — no supplier quote is claimed.

Acquisition is the largest single deduction, larger than the shipping and the card fee together. That is the fact the rest of the analysis turns on: at this basket size the business is not a product-margin problem, it is a customer-acquisition problem.

3P break-even commissionAt a 6% commission the marketplace model loses $6.02 per order and only breaks even near 13%.3P CONTRIBUTION AGAINST MARKETPLACE COMMISSION−$8−$4$0$4−$6.02assumed 6% fee$0.00break-even 13.1%0%5%10%15%20%With $8 of acquisition on every order, a 6% take rate loses $6.02. The model only clears zero at about 13%.

The same $8 of acquisition applied to a third-party order, where the platform earns a commission rather than a product spread. A 6% fee on $90 is $5.40 — it cannot carry an $8 acquisition cost and a $2.91 card fee, so the order loses $6.02 before anything goes wrong.

02

Which inverts
the usual advice.

Marketplace is normally the asset-light option: no stock, no working capital, someone else ships. But the platform still pays the card fee on the whole order and still pays to acquire the customer, while earning only the commission.

Sell first-party for the pilot, and add third-party when sellers bring their own demand — or when the take rate improves, or acquisition gets cheaper. Not before. This is a fixed scenario on one basket, not a claim that marketplaces lose money in general.

TWO MODELS, TWO LESSONSBest Buy · P.C. Richard & Son
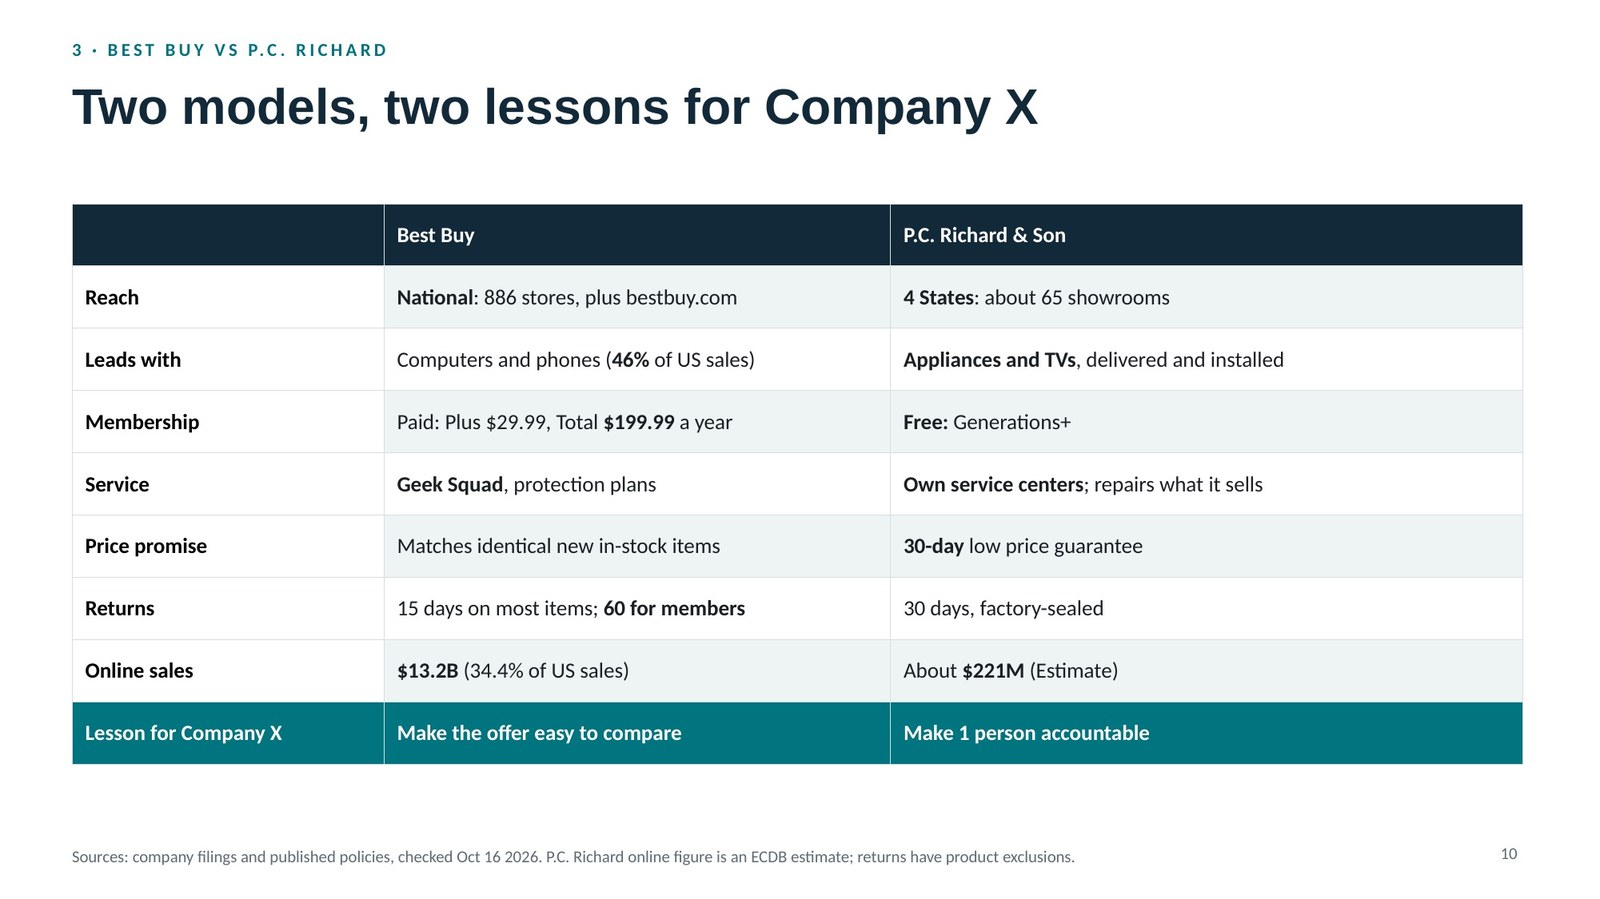
Deck slide comparing Best Buy and P.C. Richard across reach, membership, service, price promise, returns and online sales, with a lesson for Company X drawn from each.
Two of the seven benchmarked, set against each other: national scale and membership economics on one side, regional service and a 30-day identical-item price guarantee on the other. The pilot borrows the service posture, not the scale.
Costed as hurdles, not asserted as benefits

A generous return policy
has a break-even too.

A

What it would have to earn

A 14-day sealed-return window costs about $0.60 an order. Against a $7.68 baseline that needs 8.48% more orders to pay for itself. A broad opened-returns policy costs $2.50 and needs 48.3%. On a 2.00% conversion rate, the sealed option has to reach 2.17%.

B

Why it is framed as a hurdle

There is no reliable electronics-specific estimate of how much a return policy lifts conversion. So rather than assume an uplift, the model states the uplift each option would need and leaves the judgement to the owner. A break-even hurdle is checkable; a predicted uplift would not have been.

C

The asymmetry that decides it

On a $90 order a lost card dispute costs about $87 — product, card fee, shipping and the dispute fee — against roughly $15 for an ordinary return. Card networks decide “not as described” disputes whatever the store policy says, so funding a clear defect remedy is cheaper than defending against chargebacks.

The assumptions are
the whole exposure.

01

Not one supplier term is verified

The $63 landed cost, the 30% margin, the $8 acquisition cost and the 6% marketplace fee are all analyst assumptions. Sensitivity is stated rather than hidden: a $68 landed cost takes contribution to $2.92, $10 outbound takes it to $3.67, and a $16 acquisition cost takes it below zero. The conclusion survives the first two and not the third.

02

One basket, not a forecast

Everything here models a single $90 multi-item basket. The 391-order break-even is a requirement to cover $3,000 of assumed monthly fixed cost, not a sales projection, and no claim is made that the volume is achievable.

03

The company is withheld, and stays withheld

This was unsolicited work for an early-stage operator I was in conversation with. The analysis uses public retailer data and my own assumptions throughout; nothing in it came from inside the business. The name is withheld because the engagement never happened, and the argument does not need it.

04

Manufacturer photography is editorial

Product images come from Samsung, Apple and Logitech press rooms and are used to identify products under discussion. They establish no stock, authorisation or endorsement, and the proposal says so on its face. Commercial reuse rights would have to be cleared before any of it reached a live catalogue.

05 / THE PROPOSAL ITSELFOpen in a new tab ↗

Three deliverables,
one argument.

The written proposal walks the same case in order — starting point, the US retail landscape, the proposed store, the economics, operations, and the decision. A second view is a working storefront prototype, so the recommendation about what a first-time buyer needs to see before paying is demonstrated rather than described.

The slide deck is the version that would have been presented. All three are built from the same model, and every number on all three traces back to the assumptions page.

STOREFRONT PROTOTYPEsimulated prices · nothing purchasable
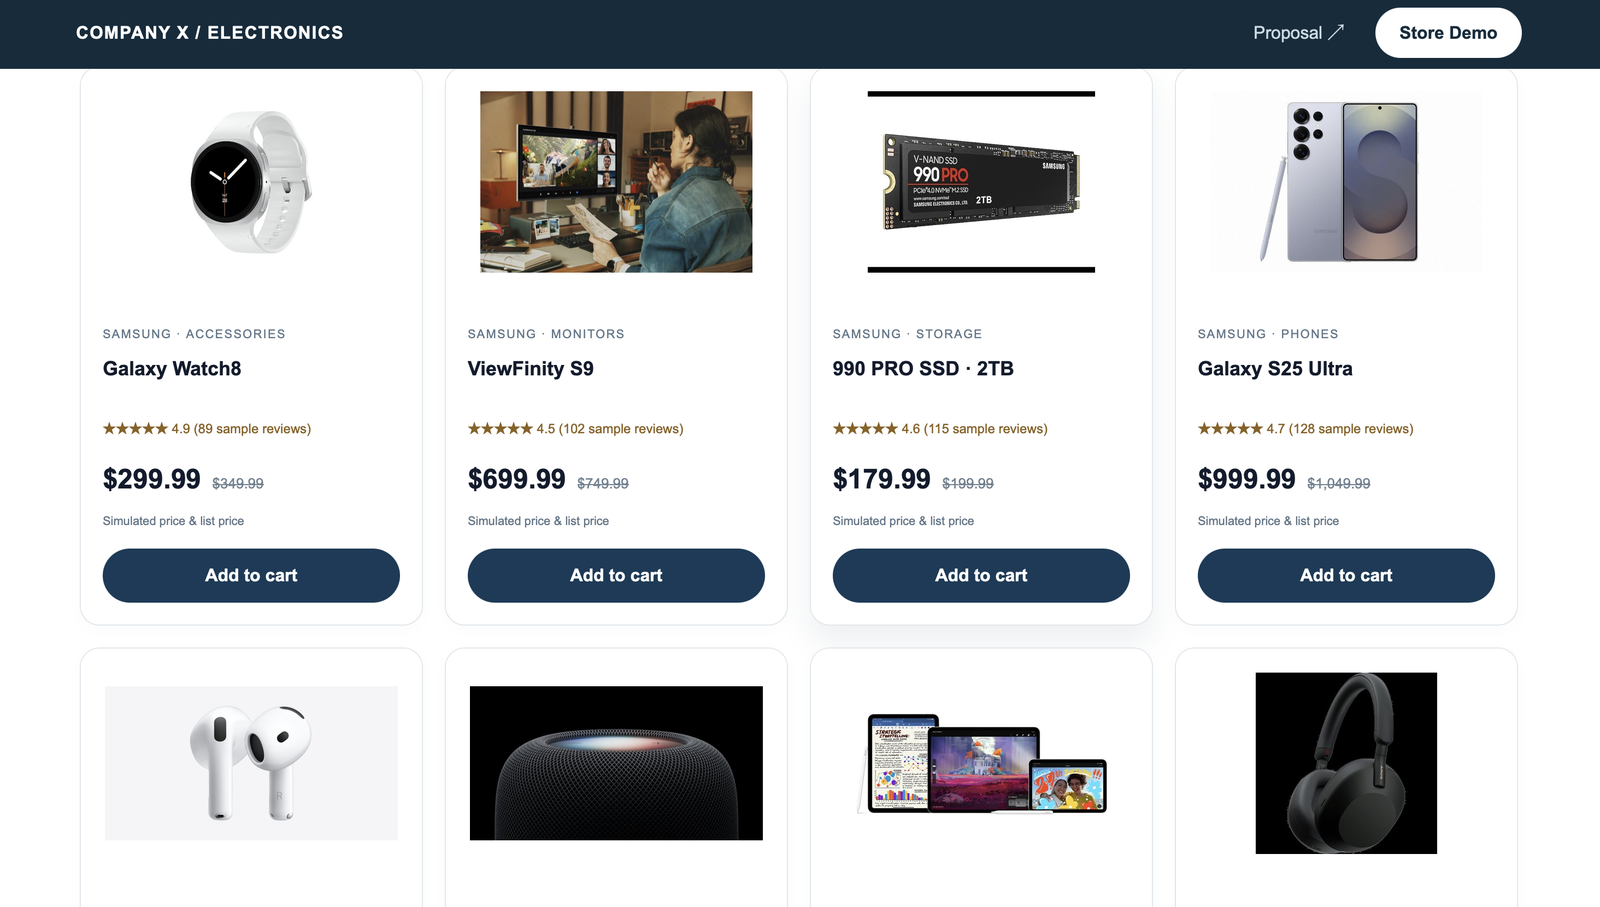
The store demo: a product grid of Samsung and Apple items with star ratings, prices marked Simulated price and list price, and Add to cart buttons.
Every price carries a “simulated price & list price” label and every review count is marked as sample data. The prototype argues for what a first-time buyer needs to see before paying, and says on each card that it is not a real listing.
!

The storefront is a prototype

It is a design demonstration with real manufacturer product photography and no commerce behind it. Nothing is purchasable, no stock is held, and no retailer relationship exists. It is labelled as an independent case study on every screen.

06 / THE OUTCOME

A recommendation
against the obvious
answer.

Start first-party at workable landed terms. Add the marketplace when sellers bring demand with them — not because it looks asset-light.

The work I would keep is the discipline of the returns section: rather than claiming a generous policy lifts conversion, it states the uplift each option would need to break even and hands the decision back with the number attached. That is the difference between an opinion and an analysis.

WHAT I’D DO DIFFERENTLY

Get one real supplier quote before modelling anything. Every number here is defensible and none is verified, and a single landed cost from an actual distributor would have anchored the whole model to something outside my own assumptions.

SOURCE & SCOPE

An independent, self-directed case study. The company is not named and supplied no data; the analysis draws on published retailer policies and market coverage from Best Buy, Amazon, Walmart, Costco and P.C. Richard & Son, the National Retail Federation, Counterpoint Research and Ingram Micro, each cited in the proposal. Product photography is from manufacturer press rooms and is used for identification only, establishing no stock, authorisation or endorsement. Every financial figure is a planning assumption rather than a supplier quote or a forecast, and the complete arithmetic is published alongside the proposal.

Proposal site ↗Planning assumptions ↗